Drive an Electric Vehicle on 100% renewables.
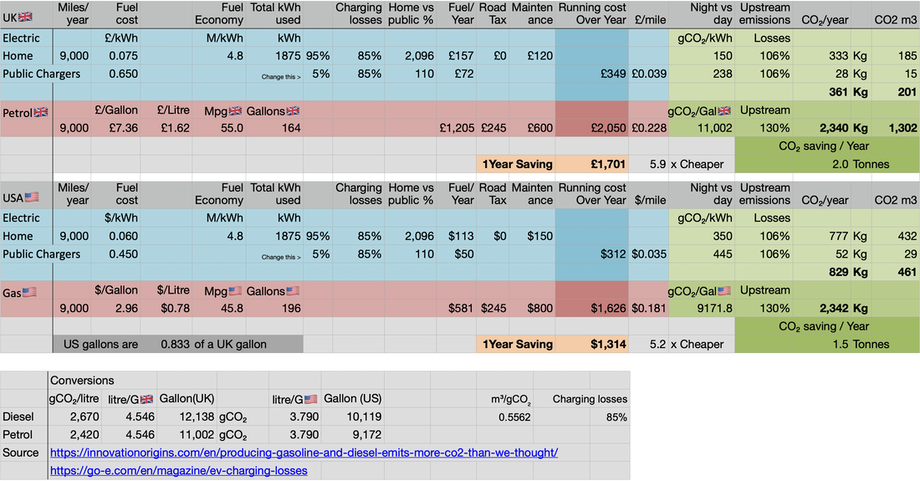
EV's have 1/7 the fuel costs
Just swapping your economical car for an EV will reduce your emissions by over 1 tonne / year
|
Download the spread sheet & mess with numbers.
|
| ||||||
|
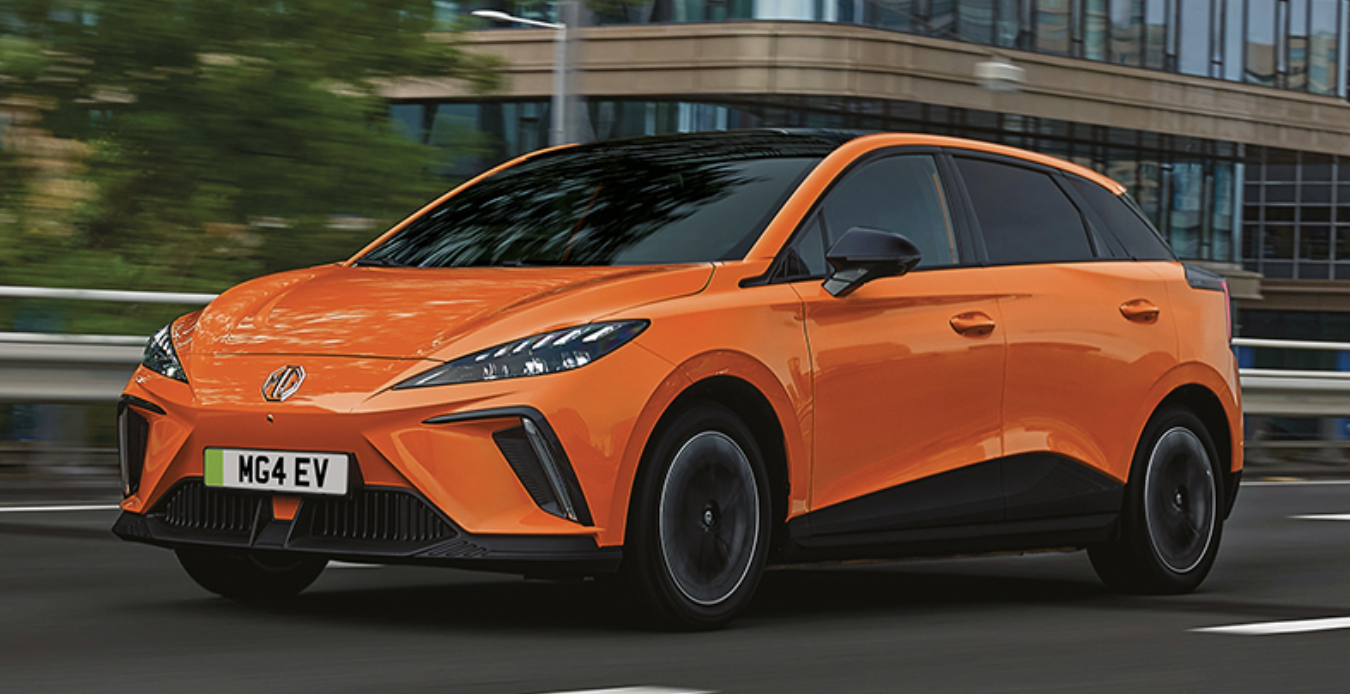
Many EV's now cost less than £27,000. Take a look at other affordable alternatives here-
Fully Charged Top 10 Electric Cars for families. |
For BusinessesEV's now are 100% tax deductible in the UK
A second hand electric van can end up costing less than £7,000 saving money year in year out.
|
Walking and cycling are always preferable to driving but if you need a vehicle..
Electric vs Fossil Fuel vs Bus
|
Download the spreadsheet for Numbers Apple and play with the variables
| ||||||
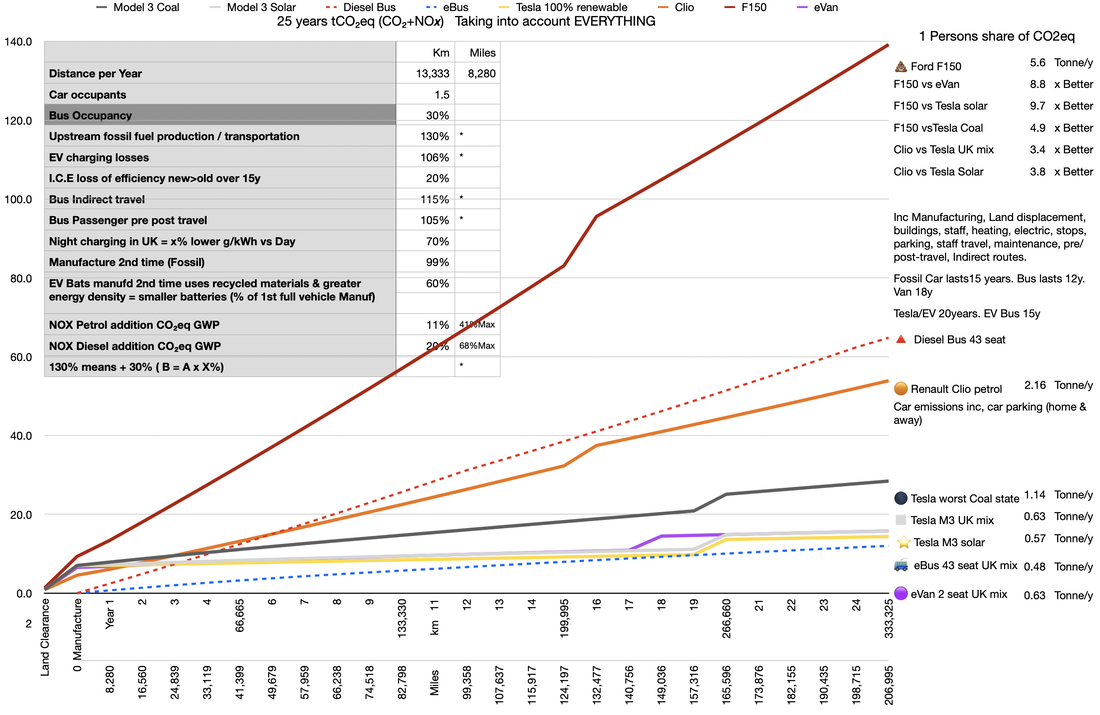
Here, I am trying to settle the EV vs ICE vs Bus argument once and for all. I have listed various vehicles then calculated all possible emissions in from well to Wheel (WTW) taking into account -
The steps in the graph show vehicle replacement every 15 years for gasoline cars & 20 for Tesla. Diesel busses last about 12 years, eBus 15? Electric van 17?
Vehicles include
So the Tesla on solar does very well against the diesel bus (contrary to current dogma), & also does very well against the eBus (UK mix), but of course all these comparisons are entirely dependent on occupancy which in my limited observations is very low for busses. Bus occupancy will never be very high. If we take morning rush hour a bus may start at the out of town Bus depot, pick up a couple of passengers at each stop, may be full by time it gets to the town centre, then the return journey may be virtually empty. Therefore the townward journey is on average 50% full and the return is only 10% full, so net occupancy is only 30%.
- Every passenger travels the same distance 13,333km/ year (8,285miles)
- Occupancy - (see legend on graph) but generally assuming Bus 30% - Car 1.5 occupants (other unfair comparisons assume a 100% full bus both directions that does not stop & start every half a mile vs a car with just one driver)
- Land clearance / loss of Carbon stored in a hectare of woodland for car park home/work, space on road
- 30% Fuel upstream CO2₂e . Producing Gasoline makes more emissions than we thought
- NOx (variations on Nitrogen dioxide) adds a surprising 50% global warming gass equivalent on top of CO₂ emissions
- Bus stations, Depots, stops, heating, lighting, staff, staff travel
- Pre travel, indirect route
- Grid emissions improving over time in line with UK targets
- Manufacturing & maintenance
- gCO₂/kWh or Gallon including the difference in US & British gallons
- Manufacturing Batteries from scratch first time then manufacturing Batteries from recycled batteries the every subsequent time
The steps in the graph show vehicle replacement every 15 years for gasoline cars & 20 for Tesla. Diesel busses last about 12 years, eBus 15? Electric van 17?
Vehicles include
- Ford F-150 - 20mpg US (17mpg UK🥴)
- Tesla Model 3 SR+ in the worst possible coal state USA
- Tesla Model 3 SR+ on rooftop solar
- Tesla Model 3 SR+ UK current electricity mix 238gCO₂/kWh dropping to the 2030 target of 100gCO₂/kWh & maintaining that level there after.
- Night time charging (Most charging is at night & has lower foot print than day)
- Renault Clio petrol (small economical family car)
- Bus Diesel 5mpg (UK) - 43 seats
- Bus Electric UK mix 43 seat
- Bus Electric UK mix 70 seat (dropped as its virtually mirrors 43)
So the Tesla on solar does very well against the diesel bus (contrary to current dogma), & also does very well against the eBus (UK mix), but of course all these comparisons are entirely dependent on occupancy which in my limited observations is very low for busses. Bus occupancy will never be very high. If we take morning rush hour a bus may start at the out of town Bus depot, pick up a couple of passengers at each stop, may be full by time it gets to the town centre, then the return journey may be virtually empty. Therefore the townward journey is on average 50% full and the return is only 10% full, so net occupancy is only 30%.
How much CO² does a fossil car produce ?
Octopus go
7.5 - 9.5p/kWh (12:30am-4:30am)
SERVICING
My first EV had a 25,000 miles or every 2 years service plan, subsequent EVs Have owned had a yearly service plan. I suspect this has more to do with bottom line rather than necessity. Servicing will cost half that of a non electric.
7.5 - 9.5p/kWh (12:30am-4:30am)
SERVICING
My first EV had a 25,000 miles or every 2 years service plan, subsequent EVs Have owned had a yearly service plan. I suspect this has more to do with bottom line rather than necessity. Servicing will cost half that of a non electric.
Vehicle To Grid
Vehicle to grid enables you to buy electricity at off peek rates, store it in your car then use or sell it back to the grid at a higher rate. This is great for storing renewables at night and cutting demand for fossil fuels at peek times ultimately reducing grid CO₂ footprint.
Here’s a more in-depth look from Electricnation
More here from the fullycharged.show
Here’s a more in-depth look from Electricnation
More here from the fullycharged.show
Many interesting transport related facts and figures such as comparison to EV and ICE, shipping, flight subsidies.
https://www.transportenvironment.org/
https://www.transportenvironment.org/
Bitcoin Lightning tips greatly appreciated
|


